Our verdict
Glassnode's on-chain metrics genuinely map holder behavior onto price in ways a candlestick chart cannot, and the Professional tier's 15 years of history and per-exchange breakdowns serve real trading desks. A casual investor paying $49 a month for the Advanced tier, with no API access and no free trial to test it first, will use a fraction of what they are buying.
Specs
- Advanced plan
- $49/month, billed annually; no published monthly-only rate
- Advanced plan coverage
- 300+ metrics, daily resolution, 4 years of history, 10 alerts
- Professional plan
- Custom quote; up to 1,500+ metrics, 15+ years of history, 500 alerts
- API access
- Not included in Advanced; optional add-on on Professional
- Free tier
- None as of 2026
- Data categories
- Spot, Futures, Options, ETFs, DATs, on-chain, macro, TradFi
- License
- Advanced is personal use only; Professional allows commercial use
- Integrations
- CLI, Excel add-in, Snowflake and BigQuery data sharing
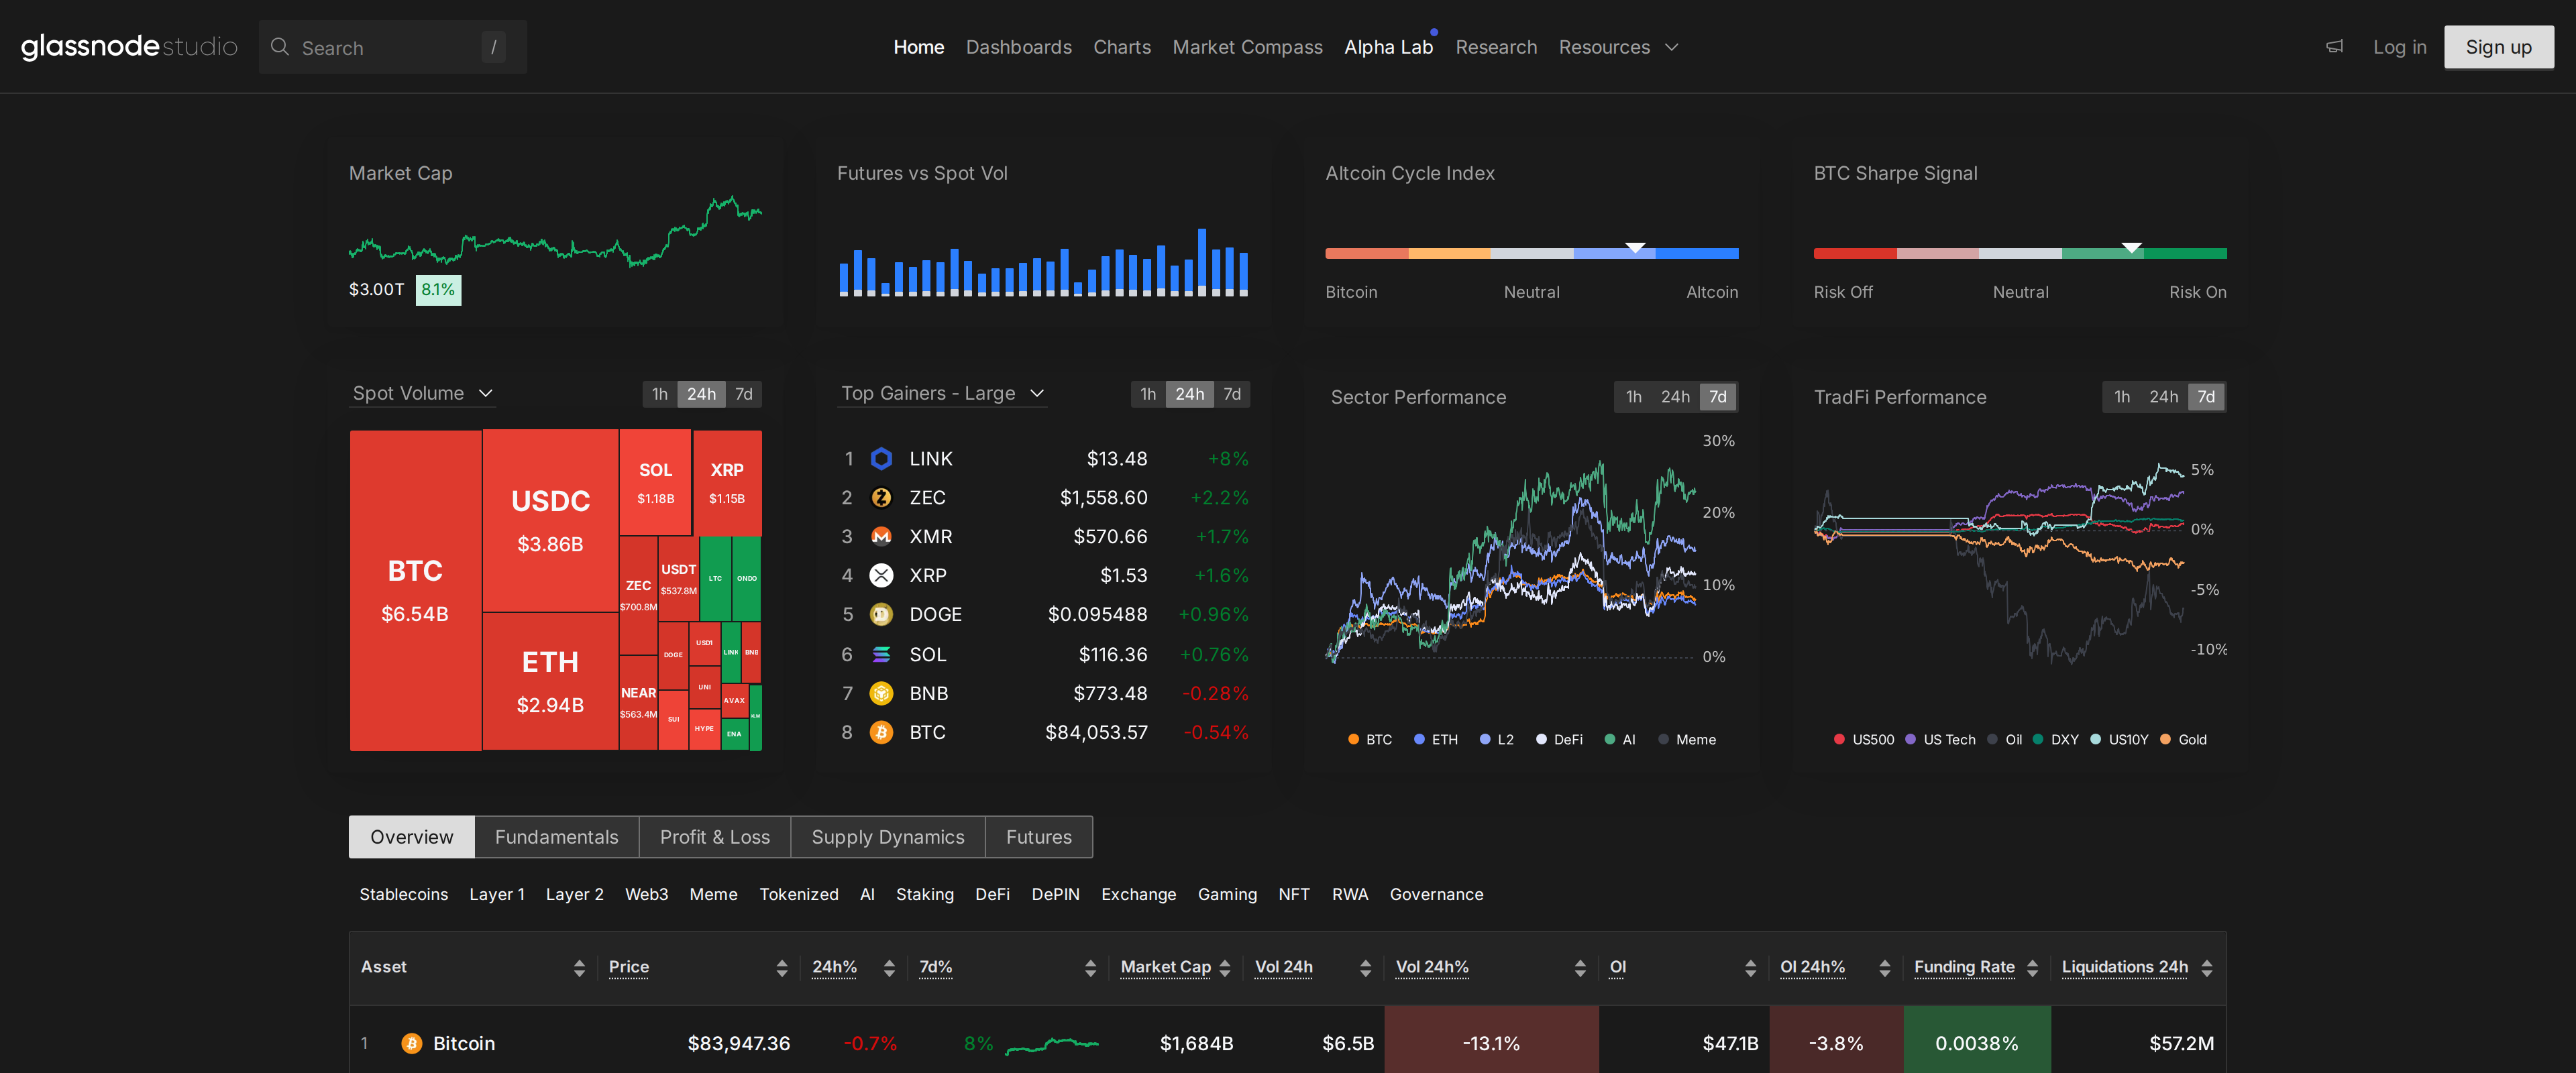
Glassnode built its name on the idea that a blockchain's public ledger holds signals a price chart never will: how long coins sit still, whether the people holding them are up or down, whether exchanges are quietly filling or draining. We signed up for the Advanced plan, pulled the metrics we actually trade on, and checked the numbers against what the marketing promises.
The free tier is gone
Anyone who remembers Glassnode letting casual users poke around a handful of free charts should update that memory. As of this year, the cheapest way in is the Advanced plan at $49 a month, billed annually, with no separate monthly-only rate published and no trial period we could find. That single change reframes the whole product: Glassnode is now something you commit to for a year before finding out if you will use it.
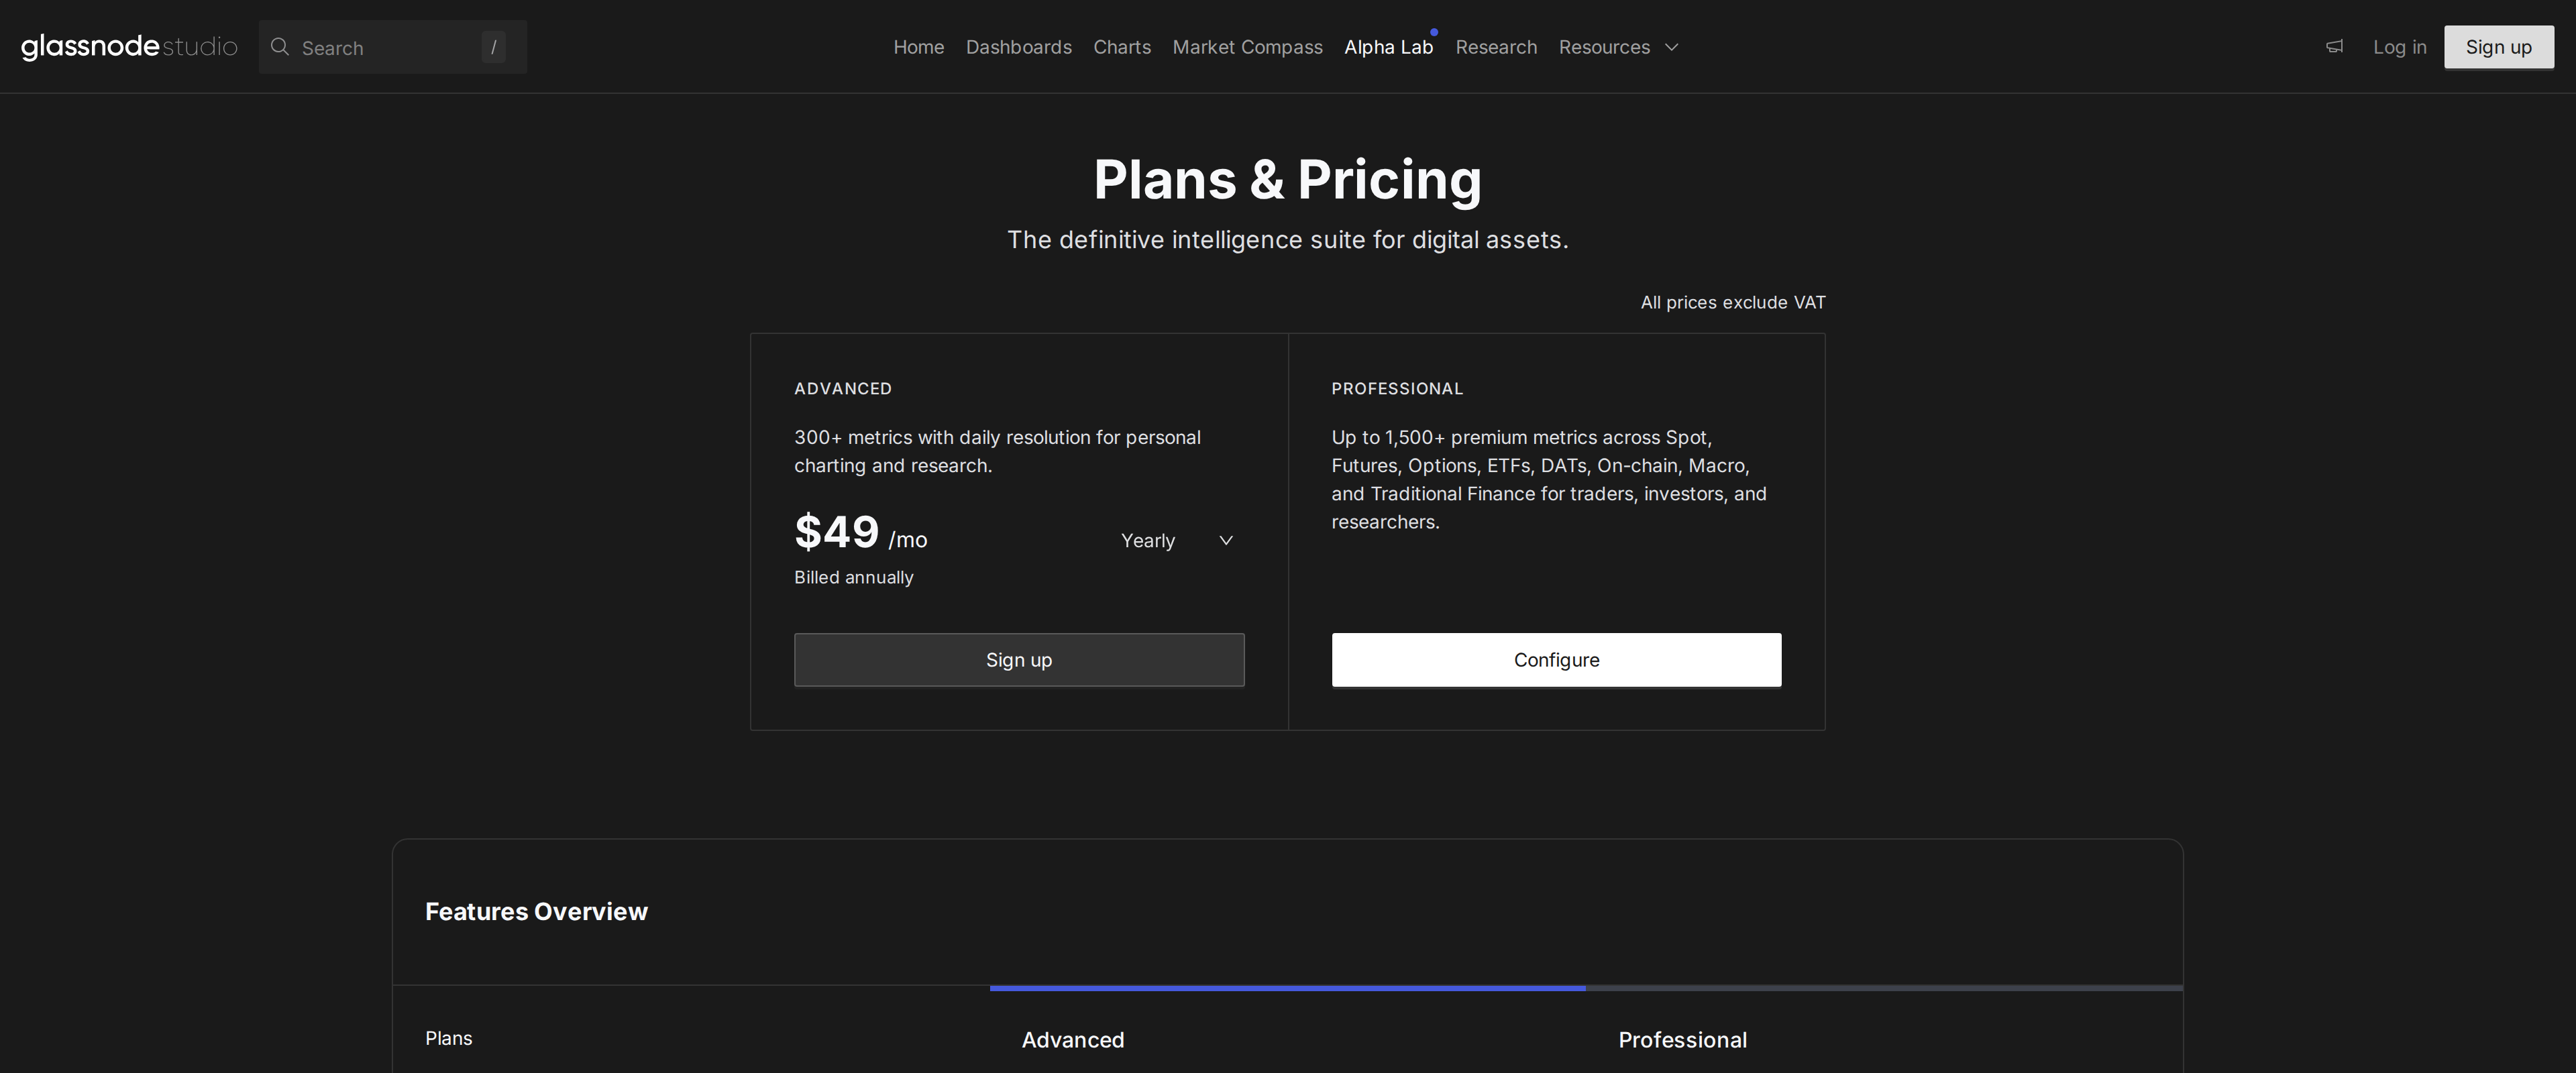
For that $49, Advanced unlocks 300 plus metrics at daily resolution and four years of history, ten alerts, and one seat, restricted to personal use. What it does not include is any API access at all: pulling the numbers into your own spreadsheet or trading bot requires stepping up to Professional, which does not publish a price and instead pushes buyers to a "Configure" form.
What the metrics actually show
We spent most of our testing time on two indicators: MVRV, which compares an asset's market value to the price its coins last moved at, and SOPR, which flags whether coins are being sold at a profit or a loss market-wide. Both did what the documentation says. During a sharp pullback we watched STH-SOPR dip under 1.0 a full day before mainstream headlines caught up, which is the kind of lead time a retail investor pays for.
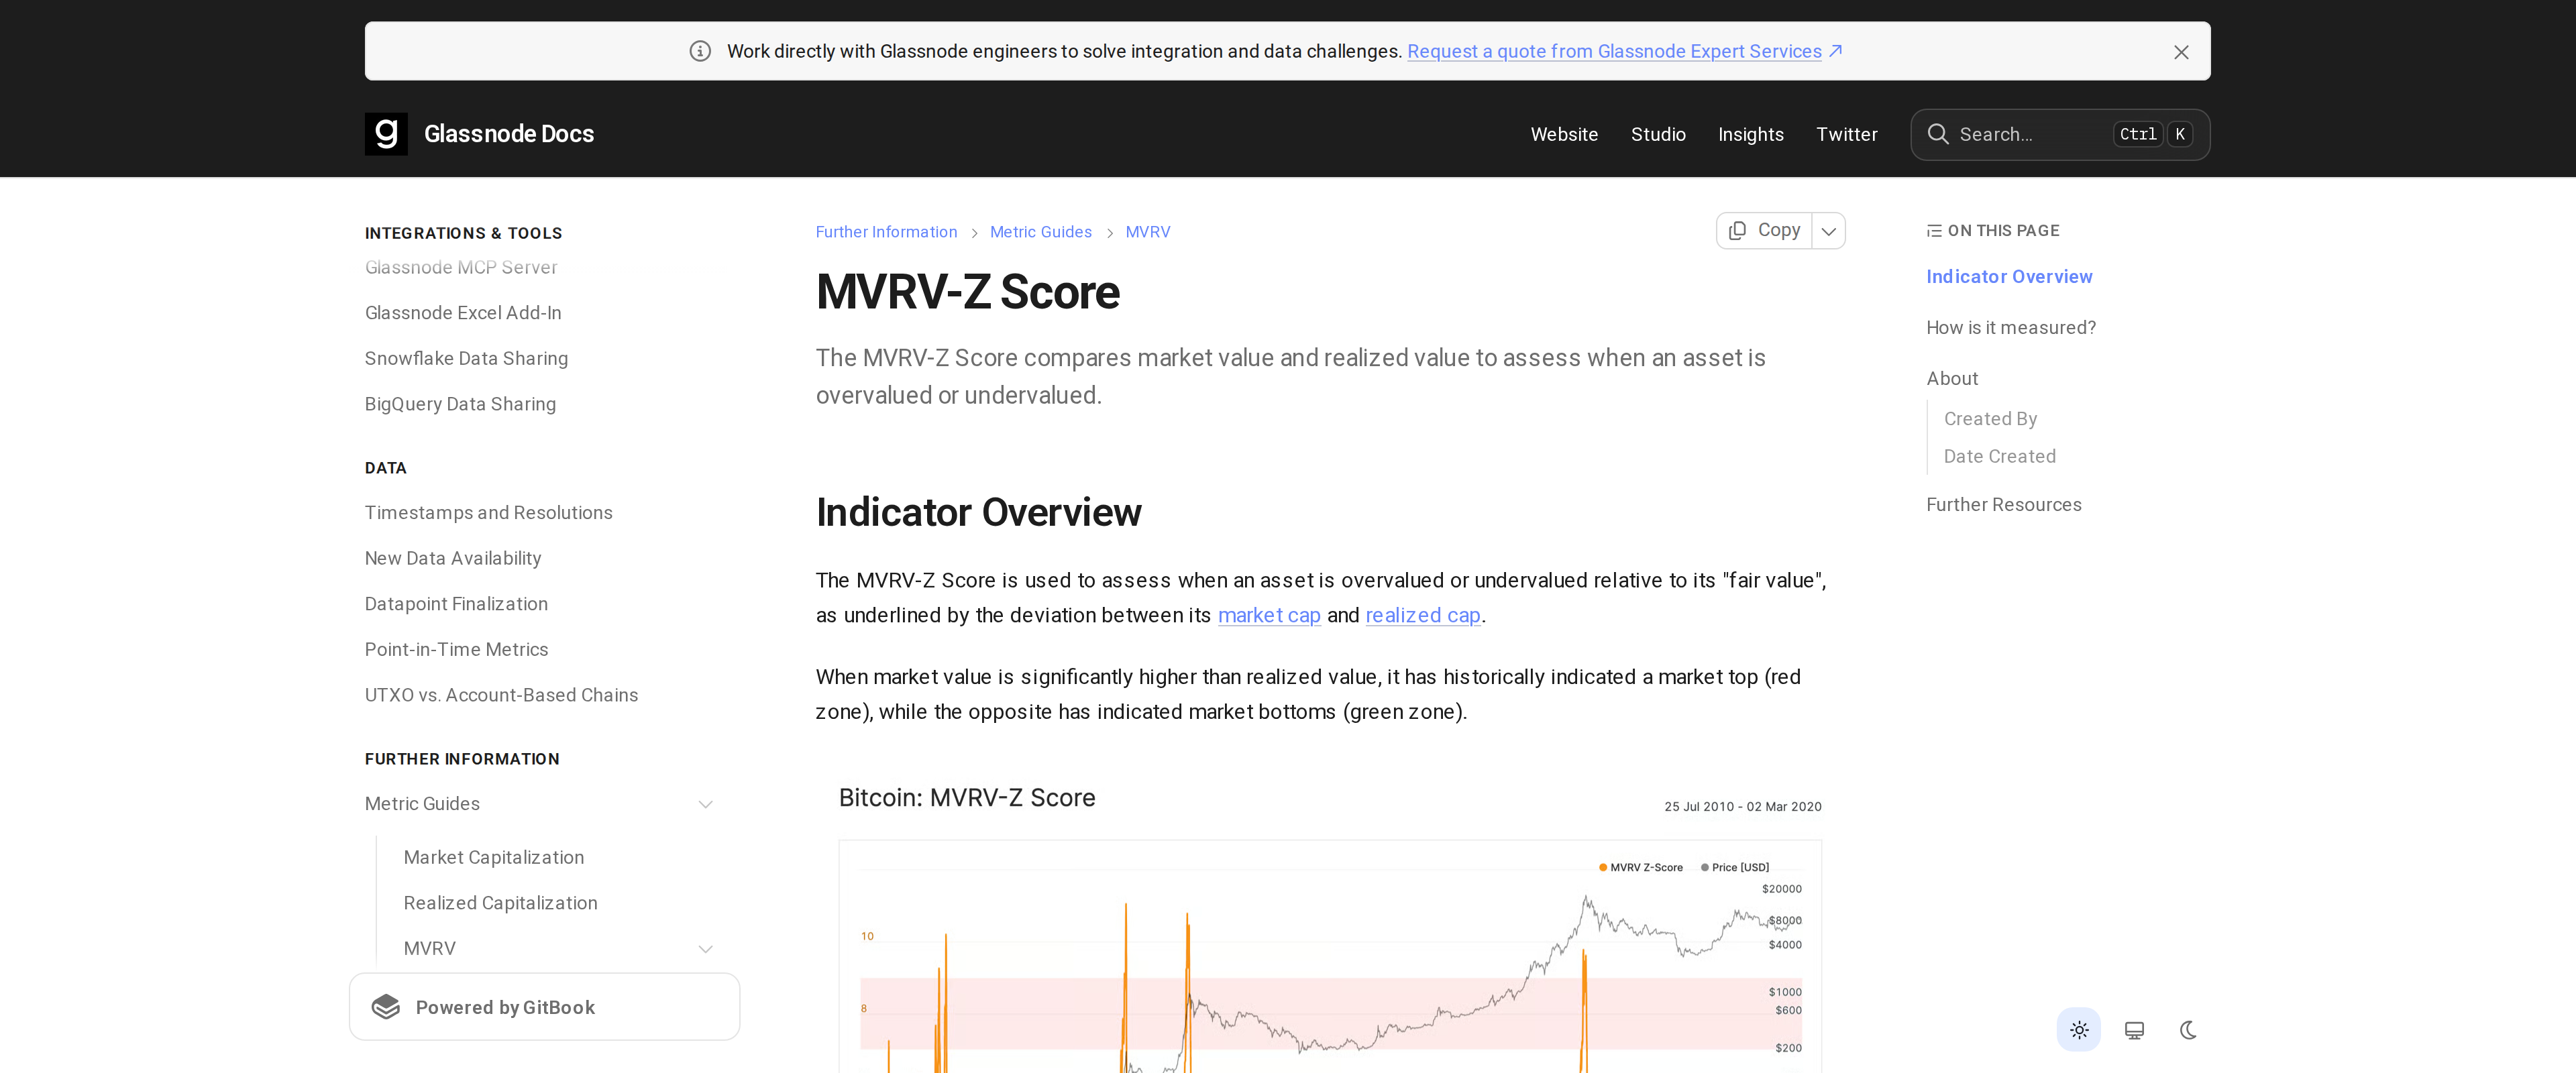
That lead time is not guaranteed, though. Glassnode's own documentation notes the MVRV-Z Score can lag in fast-moving markets and that its precision has dropped since spot Bitcoin ETFs began routing large volumes through custodians rather than the on-chain wallets Glassnode reads directly. An investor leaning on this single number without a backup plan for stop-losses is trusting a signal that Glassnode itself flags as imperfect.
We also ran a smaller test against exchange netflow, a metric that tracks coins moving onto or off exchanges as a proxy for selling or accumulation pressure. It matched the broad direction of price over the two weeks we watched it, but the size of individual flows was noisy enough that we would not size a position from a single day's reading alone. Treating any one chart as a standalone signal, rather than one input among several, is the mistake Glassnode's own research repeatedly warns against.
Research, if you would rather read than build
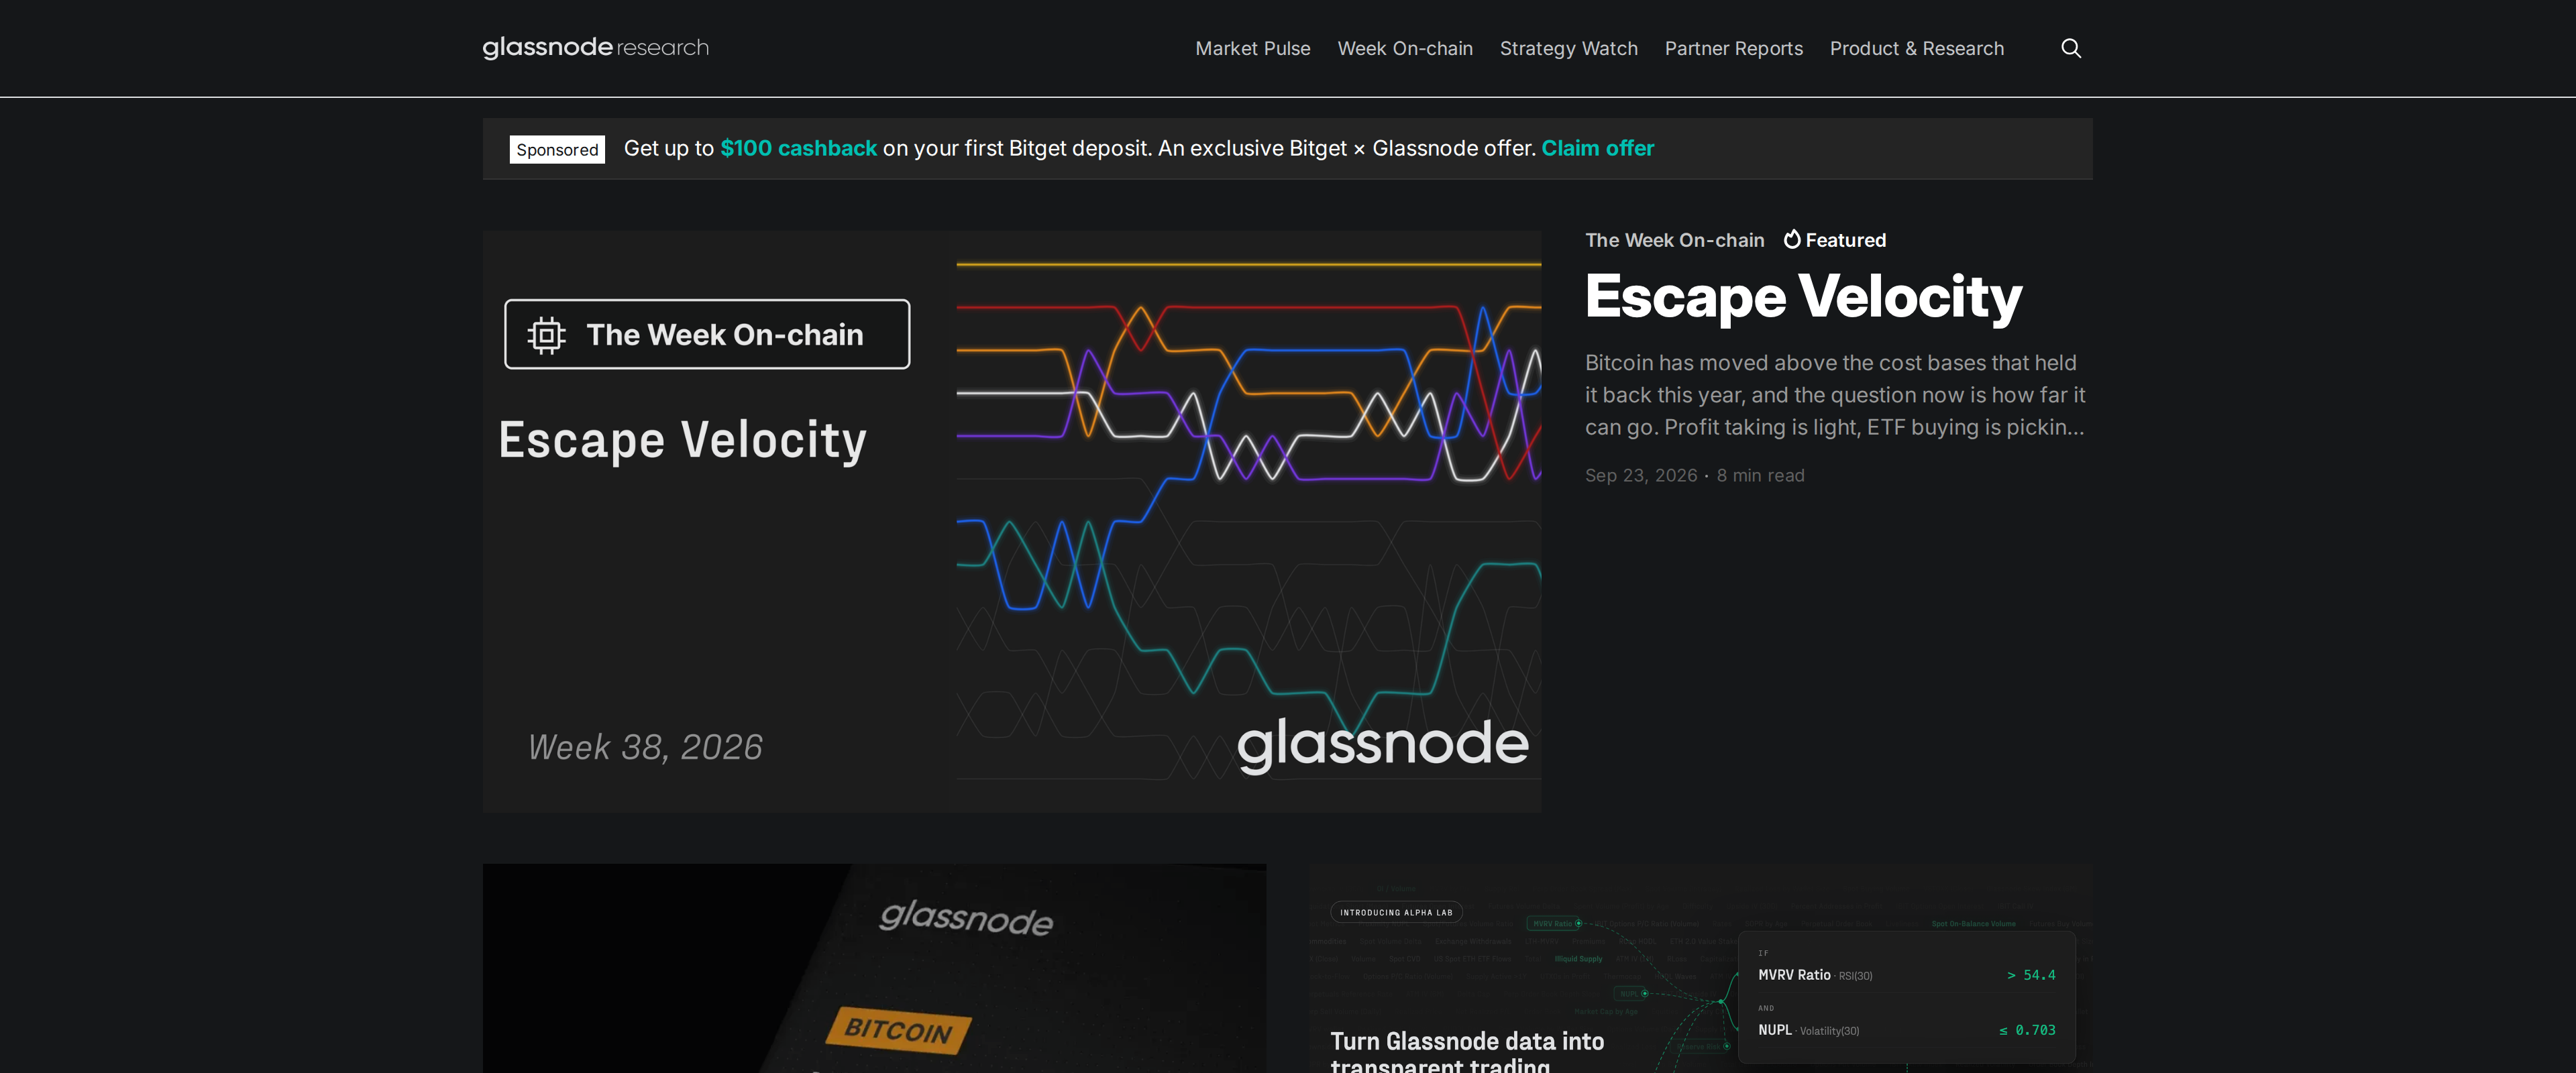
Glassnode also publishes its own market commentary through a separate research site, mixing free weekly notes with paywalled deep dives. We found the free content genuinely useful for framing a week's price action, though the best charts referenced inside those posts sit behind the same $49 wall as the Studio platform.
Who should actually pay for this
Institutional desks and full-time analysts get real value from the Professional tier's 15 years of history, per-exchange breakdowns and bulk API, especially with a G2 rating around 4.5 out of 5 backing up the data quality claims. A retail trader checking in once a week will burn through less than a tenth of what the Advanced plan offers, and would do just as well reading the free research posts and treating a paid seat as optional until trading volume justifies it.
There is also a practical licensing point worth flagging before anyone signs up. The Advanced plan is restricted to personal use in its own terms, so a small fund or a paid newsletter quoting Glassnode charts to clients is technically expected to hold a Professional seat instead, whatever the price difference turns out to be once a quote comes back. We would rather see that boundary spelled out with a number than left to a sales call.
Our verdict
Glassnode's numbers are real and the signals they build, MVRV and SOPR especially, do something a price chart cannot. The catch is cost and commitment: $49 a month with an annual billing cycle and zero API access on the cheap tier is a serious ask for anyone who has not already decided on-chain data belongs in their process. We would recommend it to traders who already know which metrics they want and will use them weekly, and we would tell a curious beginner to read the free research first.
Pros and cons
Pros
- 300+ metrics on the Advanced plan include MVRV and SOPR, which track real holder profit and loss, not just price
- The Professional tier adds per-exchange data and up to 15 years of history for desks that need it
- Bulk API, a CLI and an Excel add-in exist for anyone who wants raw numbers instead of charts
- Research articles walk through how to read each metric, so the learning curve has a map
Cons
- There is no free tier left, so testing the platform costs $49 a month minimum, billed annually
- The Advanced plan excludes API access entirely; pulling data programmatically requires the costlier Professional tier
- Metrics like the MVRV-Z Score lag in fast-moving markets and lose precision now that spot ETFs move volume off-chain
- Professional pricing is not published; buyers must request a quote through a sales configuration form
Tested and written by The Ordertide Test Desk. Published , updated . This review is not financial advice. How we review.